Whether your goal is to increase affirmative responses to your CTAs or see if your visitors like your website, it is important to use heat mapping.
Including heat mapping as part of your website optimization strategy is simple yet impactful. It is a great way to analyze user behavior and make a data-driven decision with your website.

Image Source: Adobe Stock
What is Heat Mapping?
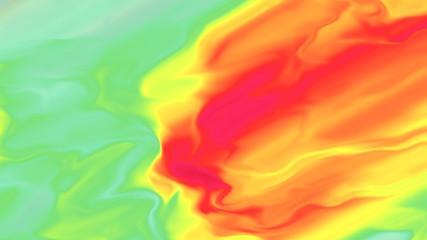
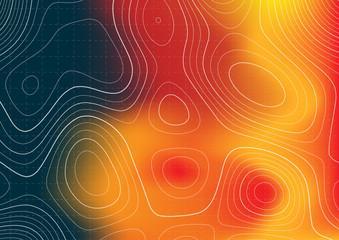
A website heat map is a tool for data visualization that can translate user behavior into a graphical representation similar to thermal imaging. In heat mapping, your website’s hottest areas are those receiving the highest engagement and the coolest parts, the lowest. The brighter the area, the more the clicks.
Heat maps can show you the buttons your users are clicking on most. It shows you the web page they are visiting most often and what part of those pages they spend the most time looking at.
Types of Heat Mapping
There are several types of website heat maps, but the widely used ones are scroll maps, click maps, and mouse-tracking heat maps. All of which share the common function of measuring user behavior on a website, but they have a few differences. The types of heat mapping include:
1. Click Maps
A click map, just as the name implies, is a heat map that shows where users click most frequently on a website and its various web pages. This will give you a clearer picture of how users engage with your site. It also notifies you of what prompts and Calls to Action your users find most compelling.
Click maps can also help you find out problem areas with your website. If few users interact with a certain Call to Action, or if their clicks indicate a broken link or a bug, these trends will be recorded on a click map.

Image Source: Adobe Stock
2. Scroll Maps
Scroll maps are made to record user behaviors that would indicate problems with the format and length of a webpage. If someone stops scrolling halfway down the page, you can assume that this is the point at which they lost interest. This could be because it is too difficult to navigate.
3. Mouse-Tracking Heat Maps
A mouse-tracking heat map, otherwise called hover map, is a combination of a click map and a scroll map. While the previous two types of heat maps dwell on a particular facet of user activity, mouth-tracking heat maps measure how people behave on a website.
Mouse heat maps track clicking, scrolling, and even the movement of the mouse itself. This can come in handy in showing web designers and business owners which aspects of web page users find most interesting.
Users who are drawn to a particular image or graphic might tend to leave their mouse lingering over it.
The precise information gotten from using this heat map is, however, questionable. This is because visitors might be staring at the content they are not hovering over. There is also the possibility of them hovering over areas that get little attention.

Image Source: Adobe Stock
Who Should Use a Website Heat Map?
A heat map is designed for all website and online business owners. We recommend all professionals from engineers, doctors, marketers, and generally, anyone who runs an online business should add this design to their website. This would help boost conversion rate by; giving you insights into what your visitors do, so you know the areas that need more attention.
Why Should Your Website Have a Heat Map?
If believe on a web design agency, it not only does heat mapping provide great customer insights. It can also help you address serious problems with your web design that may be hindering your online business performance.
Below, we shall mention some of the reasons why you should consider adding a heat mapping to your website.
1. Improve User Experience
Web analytics like Session Duration and Bounce Rate may help tell you how long someone spent on your website, but heat maps can help better explain why they stayed or why they left.
If your heat maps show a quick decrease in activities from the information at the top of the page to the bottom, you might have a user experience issue. Maybe the information you have shared is not what the user was looking for. Or, you did not give them enough direction to keep them moving down the page.
You can use heat maps to make adjustments to your web pages and check for improvement on the page afterward.
2. Collect Customer Data
If your business site has an e-commerce component, it is important to have customer data that shows you which of your products are clicked on the most. This will, in turn, help you make important decisions with regards to sales purchases, inventory, and marketing in general.
For instance, if you know that certain products tend to drive more sales during some seasons, you might use that information to create timely email marketing or paid search campaigns.
3. Heat Mapping Can Help You Identify Navigating Issues
With great navigation, a heat map should show you that users are clicking the right menu items that begin their journey into the sales funnel. You can see that your customers are moving from top-level information pages to areas where they can request more information or make a purchase.
On the other hand, with bad navigation, there may be a significant drop-off from the homepage and other top-level pages. This could be a prompting that you need to change your navigation. This will help you provide better guidance for site visitors so that they can know where they can go to take further action on your website.
4. Heat Mapping Gives You an Insight on the Best Area to Put an Element
Because heat mapping gives you data on the worst and best part of your webpage, it will help you to make the right decision. It will help you decide on the perfect portion to place important information, so there are high chances of visitors accessing it. This will lead to a higher conversion rate for the
What are some of the Best Heat Mapping Tools?
Heat maps are inexpensive tools. Many of them are free, while some of them have low-cost monthly subscriptions. There are varieties of heat mapping tools available online. Some of the best options are as follows:
1. Crazy Egg
Crazy Egg is the most popular tool for heat map generation. The various heat map options available are all divided by traffic sources. This helps you to see how visitors on your site interact differently.
Crazy Egg offers simple plans that do not limit you to usage on a single Crazy Egg account for all of the websites you run.
2. Mouseflow
Mouseflow is optimized for WordPress users. Here, the services in click mapping, scroll mapping, and mouse mapping make it simple to see how visitors interact with your website.
The service includes Form Analytics. This can help you see when and why visitors close forms while browsing your website.
Mouseflow has a free version limited to a website with up to 100 recorded sessions. The paid version allows you to have up to 1,000 recorded sessions on a single site.
3. HotJar
By packaging multiple website analytics and conversion tools, HotJar stands out as one of the most effective heat mapping tools available. On top of offering session recordings, polls, and funnels, HotJar also has an easy-to-use dashboard. This dashboard makes it perfect for anyone new to heat mapping.
4. Heatmap. Me
This is one of the simplest heat mapping tools. Heatmap.Me has an intuitive user interface and uses a small Java code string to record your site visitors’ behavior without showing the site down.
Users can install this code on up to five pages for free. Sometimes, a higher monthly rate is requested for use on unlimited web pages. This price is due to the fact that Heatmap.Me offers real-time web analytics. In other words, you can see customers interacting with your website live.
5. Lucky Orange
A self-proclaimed “all-in-one-optimizing site,” Lucky Orange offers to click mapping, scroll mapping, and mouse mapping for a low monthly price.
In addition to these services, it also gives users access to features like session recording.
The service also makes it possible to add polls and chat widgets to your site to promote further customer engagement.
Some of the Things We’ve Learnt from Heat Map Tests
1. The Most Prominent Item Gets Chosen
When customers visit your page and seem to be in a hurry, they tend to care less about their preferences. In cases like this, they make choices based on what appears most prominent. This happens because when a person is in a hurry, visual impacts guide them more than their preferences. The more a person is distracted, the stronger this bias becomes.
Strategic tweaks to a web design can shift the attention of visitors.
2. Your Content is Read in an F-shaped Pattern
A study showed that viewers read web content in an F-shaped motif. This means that when people read when content, their major attention goes to the beginning of the text. They skim, spend the most time on important headings and subheadings, and then read the rest of the text in a selective manner.
Due to this study, it is important to state the most important information in the first two to three paragraphs.
The F-shaped reading pattern is not applicable when viewing a picture-based webpage. Instead, visitors tend to view these pages in a horizontal pattern.
3. People Look More to the Left Side of your Page
Studies show that visitors look at the left side of your webpage first and then spend a long time there.
While this might not hold in all cases, we commend that you place more important information there. Put the left side of your website in mind.
4. Real Human Photos Draw
People respond better to real photos. Adding a well-selected photo of real humans tends to keep visitors for a longer time.
Various heat map studies show that visitors spend more time on webpages with real human pictures, especially facial features.
We suggest that you increase your conversion rate by adding photos with facial characteristics to your webpage.
Conclusion
A website heat map is a data visualization tool that translates user behavior into a graphical representation. There are several heat maps, but widely used are Click Maps, Scroll Maps and Mouse-tracking Heat Maps. Some of the best heat mapping tools are Crazy Egg, Mouseflow, HotJar, Heatmap.Me, and Lucky Orange.
We hope that our article has been able to answer your questions on heat maps. For help designing your website or for more information on how to improve your website’s user interface, contact Monify Media. If you have questions or contributions, kindly leave us a comment in the comment section below.


very good article thanks for sharing this useful information good luck for the website
very useful and valuable information, keep sharing such information